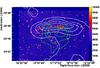
Fig. 6
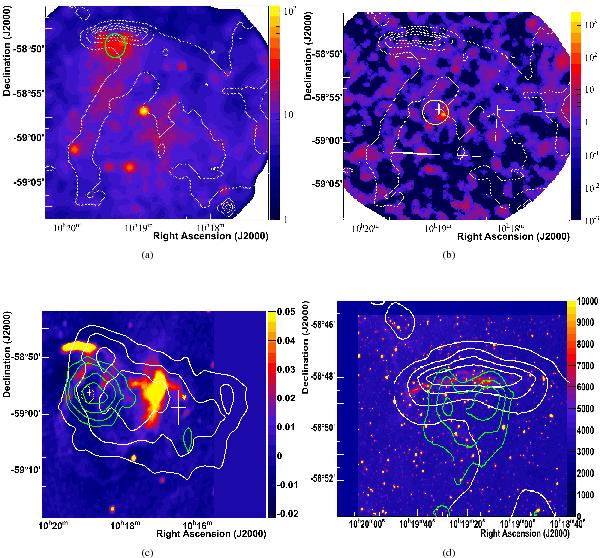
Multi-wavelength view of the HESS J1018–589 region. On the top left a) XMM-Newton exposure-corrected counts map centered on SNR G284.3–1.8 in the 0.3 to 2 keV energy band in color scale combining the three EPIC cameras. The image (in excess per arcmin2) is in logarithmic scale and it was adaptively smoothed to emphasize the extended thermal emission. The white-dashed contours show the radio image of SNR G284.3–1.8 from MOST-Molonglo observations at 843 MHz. The extraction region to evaluate the diffuse X-ray emission is shown in green. On the top right b) XMM-Newton exposure-corrected counts map with the EPIC cameras at high energies in the 2 to 8 keV energy band. The white cross and yellow circle mark the best fit position of the H.E.S.S. point-like emission and the 95% confidence level of the Fermi-LAT source 2FGL J1019.0–5856. On the left bottom c) the significance contours for the two different oversampling radii for HESS J1018–589 are shown in green (0.1°) and white (0.22°). The best-fit positions (white cross) of the VHE γ-ray, superimposed on the MOST-Molonglo radio map are displayed, together with the position of PSR J1016–5857 (yellow star) and 2FGL J1019.0–5856 (in dashed-yellow). On the right bottom d) a zoom of the radio shell (in white) is shown together with the contours of the thermal emission in green and Hα observations from the SuperCOSMOS H-alpha Survey (in intensity units).
Current usage metrics show cumulative count of Article Views (full-text article views including HTML views, PDF and ePub downloads, according to the available data) and Abstracts Views on Vision4Press platform.
Data correspond to usage on the plateform after 2015. The current usage metrics is available 48-96 hours after online publication and is updated daily on week days.
Initial download of the metrics may take a while.