Fig. 5
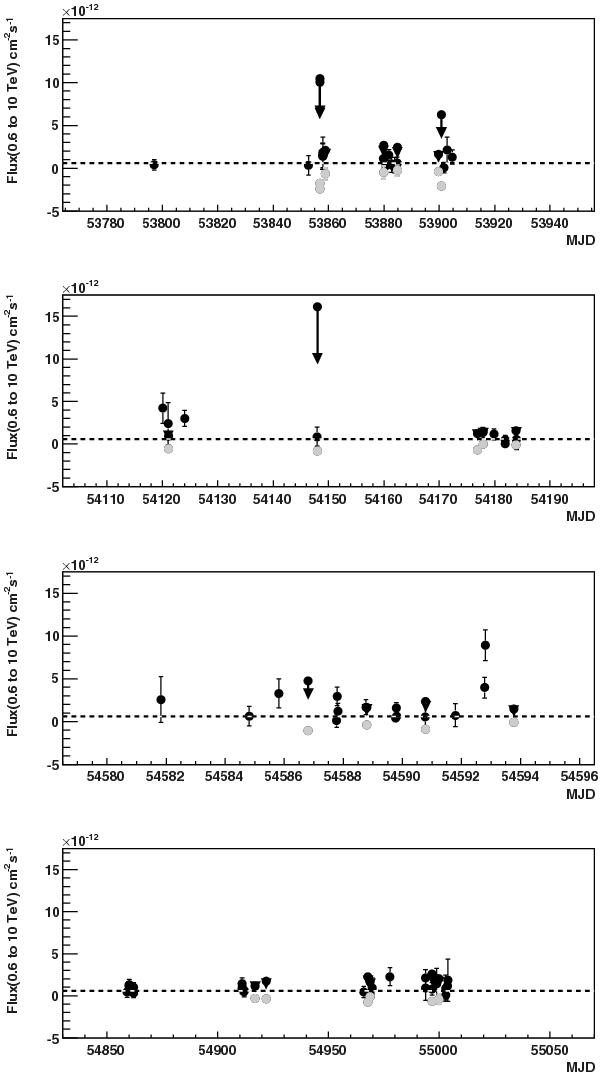
Light curve of the integral flux between 0.6 TeV and 10 TeV in a 0.1° region centered on position A binned such that each point represents the data in one H.E.S.S observing run (typically 28 min). An upper limit for 99% confidence level is shown with an arrow when the fluctuation in the integral flux is negative (grey points). The dashed horizontal line shows the mean integral flux.
Current usage metrics show cumulative count of Article Views (full-text article views including HTML views, PDF and ePub downloads, according to the available data) and Abstracts Views on Vision4Press platform.
Data correspond to usage on the plateform after 2015. The current usage metrics is available 48-96 hours after online publication and is updated daily on week days.
Initial download of the metrics may take a while.