Fig. 3
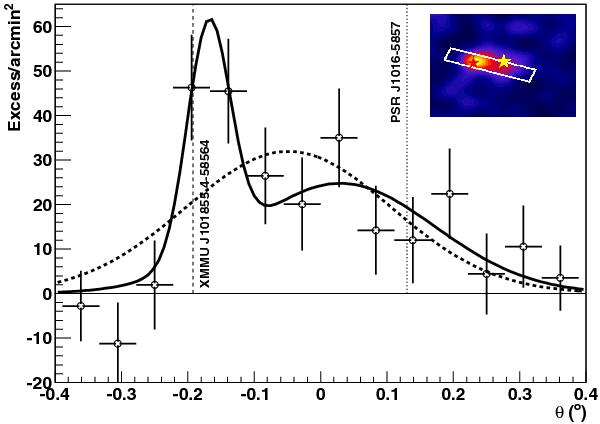
Profile of the VHE emission along the line between the peak of the point-like emission and the peak of the diffuse emission, as illustrated in the inset. Fits using a single and a double Gaussian function are shown in dashed and solid lines respectively. The positions of XMMU J101855.4–58564 and PSR J1016–5857 are marked with dashed and dotted vertical lines and red and yellow stars in the inset, in which the significance image obtained using an oversampling radius of 0.1° is shown.
Current usage metrics show cumulative count of Article Views (full-text article views including HTML views, PDF and ePub downloads, according to the available data) and Abstracts Views on Vision4Press platform.
Data correspond to usage on the plateform after 2015. The current usage metrics is available 48-96 hours after online publication and is updated daily on week days.
Initial download of the metrics may take a while.