Fig. 2
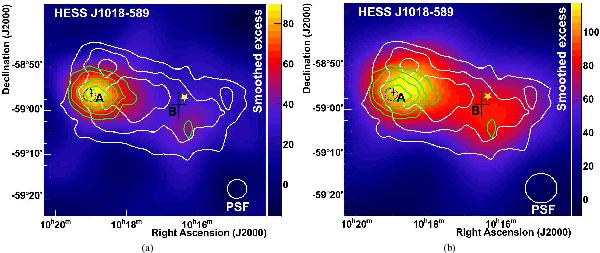
H.E.S.S. excess image of the HESS J1018–589 region smoothed with a Gaussian of width σ = 0.07° (on the left, a) and σ = 0.11° (on the right, b). Significance contours, calculated using an oversampling radius of 0.1° (in green) and 0.22° (in white) are shown, starting at 4σ in steps of 1σ. The black crosses (A and B) mark the best-fit position and statistical errors at 1σ level for the two emission regions (see text for details). The position of 1FGL J1018.6–5856 is shown with a blue dashed ellipse (95% confidence level) while the position of PSR J1016–5857 is marked with a yellow star. The white circles illustrate the size of the (68% containment radius) PSF smoothed with the two different Gaussian widths used.
Current usage metrics show cumulative count of Article Views (full-text article views including HTML views, PDF and ePub downloads, according to the available data) and Abstracts Views on Vision4Press platform.
Data correspond to usage on the plateform after 2015. The current usage metrics is available 48-96 hours after online publication and is updated daily on week days.
Initial download of the metrics may take a while.