Fig. 3
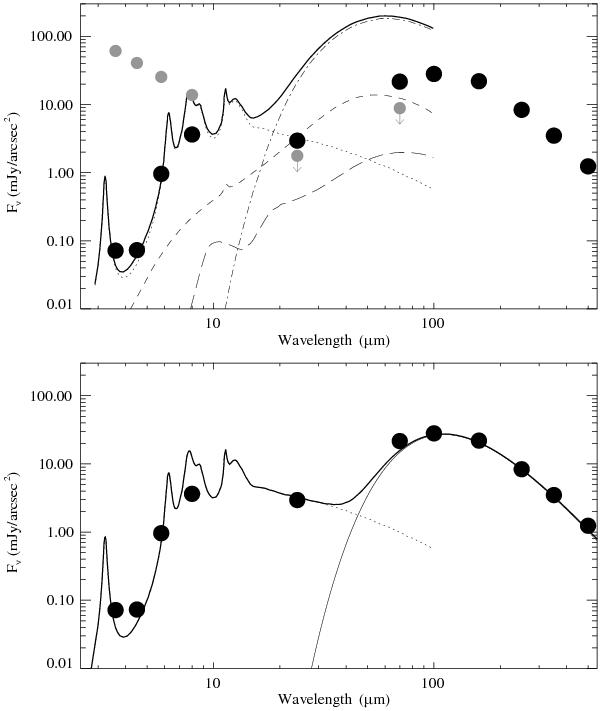
Upper panel: dust model for the ring from Siebenmorgen et al. (1998). Dotted line: PAHs; dashed line: very small graphite; long dashed line: very small silicates; dash-dotted line: large grains. The small gray dots (from this work) mark the observational data or upper limits for the stellar photosphere, while the large black dots (also from this work) represent the ring emission as measured at a distance of 20′′, PA of 142° from the star (position 7 in Siebenmorgen et al. 1998). Error bars are smaller than the symbol sizes, thus they are not plotted. Lower panel: the large black dots are the same observations as in the upper panel, but the overplotted model (thick solid line) is the sum of the PAHs from Siebenmorgen et al. (1998) (dotted line) and a single-temperature modified black body (thin solid line) with T = 26.0 K and β = 2.0.
Current usage metrics show cumulative count of Article Views (full-text article views including HTML views, PDF and ePub downloads, according to the available data) and Abstracts Views on Vision4Press platform.
Data correspond to usage on the plateform after 2015. The current usage metrics is available 48-96 hours after online publication and is updated daily on week days.
Initial download of the metrics may take a while.