Fig. 9
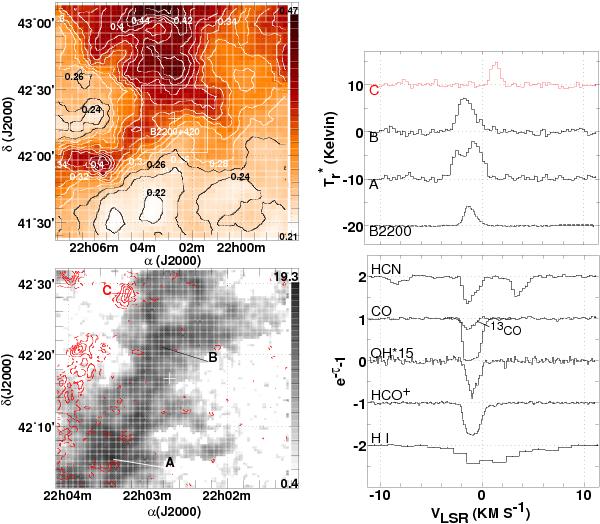
The sky field around the position of B2200+420 (BL Lac), as in Fig. 2. The map of CO emission at lower left superposes the integrated intensity in the range v = 0−2 km s-1 as red contours against a background grayscale representing emission at v ≤ 0 km s-1. Molecular absorption and most emission is sequestered in the blue wing of the core of the HI absorption profile but a red-shifted emission component is present to the Northeast as illustrated by the spectrum at position “C” indicated at lower left.
Current usage metrics show cumulative count of Article Views (full-text article views including HTML views, PDF and ePub downloads, according to the available data) and Abstracts Views on Vision4Press platform.
Data correspond to usage on the plateform after 2015. The current usage metrics is available 48-96 hours after online publication and is updated daily on week days.
Initial download of the metrics may take a while.