Fig. 8
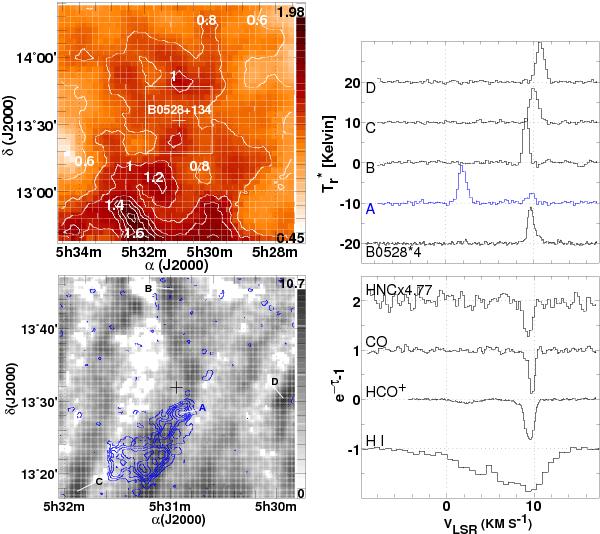
The sky field around the position of B0528+134, as in Fig. 2. The map of CO emission at lower left superposes the integrated intensity at 0 − 4 km s-1 as blue contours against a background grayscale representing emission at v = 8 − 12 km s-1. Very strong CO lines are seen in the foreground gas as shown in the upper right panel: positions at which they originate are indicated at lower left.
Current usage metrics show cumulative count of Article Views (full-text article views including HTML views, PDF and ePub downloads, according to the available data) and Abstracts Views on Vision4Press platform.
Data correspond to usage on the plateform after 2015. The current usage metrics is available 48-96 hours after online publication and is updated daily on week days.
Initial download of the metrics may take a while.