Fig. 6
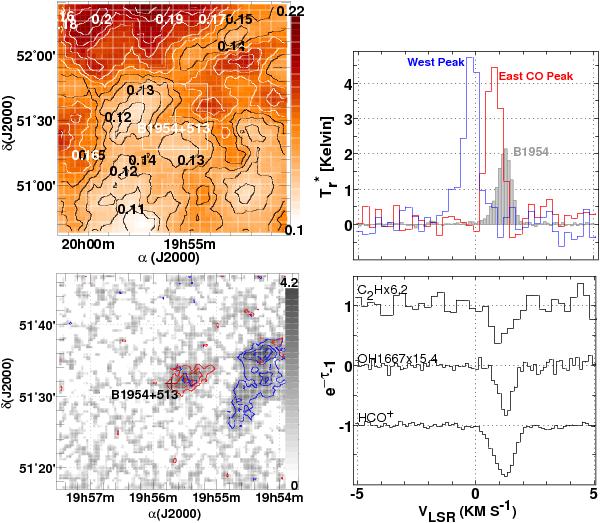
The sky field around the position of B1954+513, as in Fig. 2. In the map at lower left the grayscale represents the total integrated emission at −1 ≤ v ≤ 2 km s-1 and the red and blue contours show the individual distributions of red and blue-shifted components, respectively. Profiles at the peak of the red and blue-shifted emission components are shown at upper right along with the profile toward the continuum source (shaded).
Current usage metrics show cumulative count of Article Views (full-text article views including HTML views, PDF and ePub downloads, according to the available data) and Abstracts Views on Vision4Press platform.
Data correspond to usage on the plateform after 2015. The current usage metrics is available 48-96 hours after online publication and is updated daily on week days.
Initial download of the metrics may take a while.