Fig. B.1
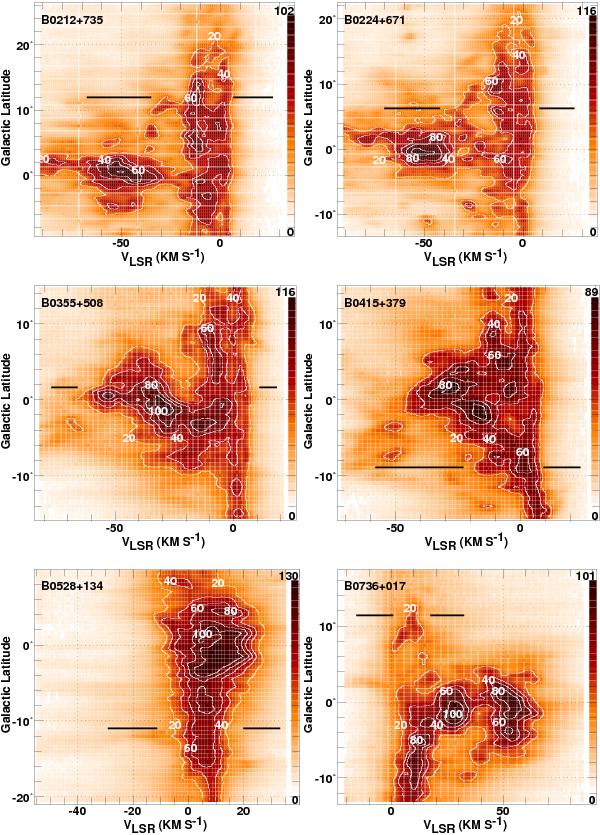
Latitude-velocity diagrams of H I brightness around six background targets used for mm-wave molecular absorption studies, using H I data from the LDSS survey (Hartmann & Burton 1997). The spatial resolution is 35′ and the diagrams were constructed at the nearest longitude on the 0.5° grid of the survey datacube. The latitudes of the sources are marked. The line of sight toward B0415+379 (3C 111) is not discussed in this work.
Current usage metrics show cumulative count of Article Views (full-text article views including HTML views, PDF and ePub downloads, according to the available data) and Abstracts Views on Vision4Press platform.
Data correspond to usage on the plateform after 2015. The current usage metrics is available 48-96 hours after online publication and is updated daily on week days.
Initial download of the metrics may take a while.