Fig. 2
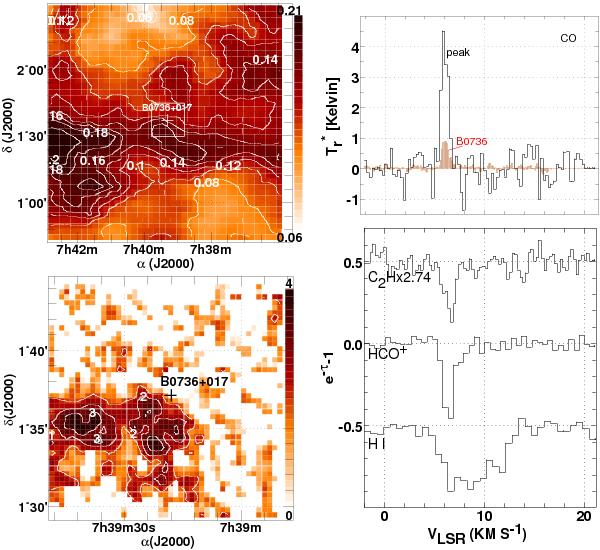
The sky field around the position of B0736+017. Upper left: reddening at 6′ resolution (Schlegel et al. 1998). The inscribed white rectangle shows the smaller region mapped in CO emission. Lower left: integrated CO emission WCO in units of K km s-1; contour levels are in 1, 2, ... K km s-1. Lower right: absorption line profiles, scaled as noted. Upper right: CO emission, toward B0736+017 and at the peak of the nearby CO distribution.
Current usage metrics show cumulative count of Article Views (full-text article views including HTML views, PDF and ePub downloads, according to the available data) and Abstracts Views on Vision4Press platform.
Data correspond to usage on the plateform after 2015. The current usage metrics is available 48-96 hours after online publication and is updated daily on week days.
Initial download of the metrics may take a while.