Free Access
Fig. 14
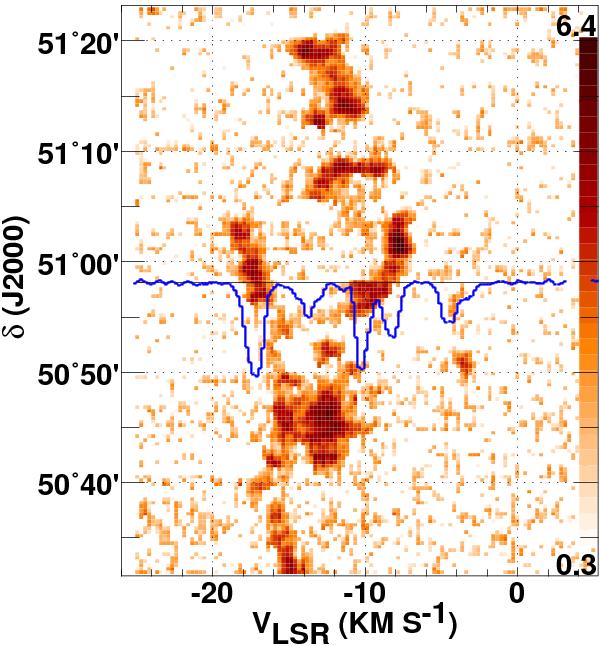
A declination-velocity diagram of CO emission at the right ascension of B0355+508. The CO absorption spectrum toward B0355+508 is shown with its baseline level at the declination of the background source. The strongest CO absorption line is quite opaque, see Fig. 12.
Current usage metrics show cumulative count of Article Views (full-text article views including HTML views, PDF and ePub downloads, according to the available data) and Abstracts Views on Vision4Press platform.
Data correspond to usage on the plateform after 2015. The current usage metrics is available 48-96 hours after online publication and is updated daily on week days.
Initial download of the metrics may take a while.