Fig. 12
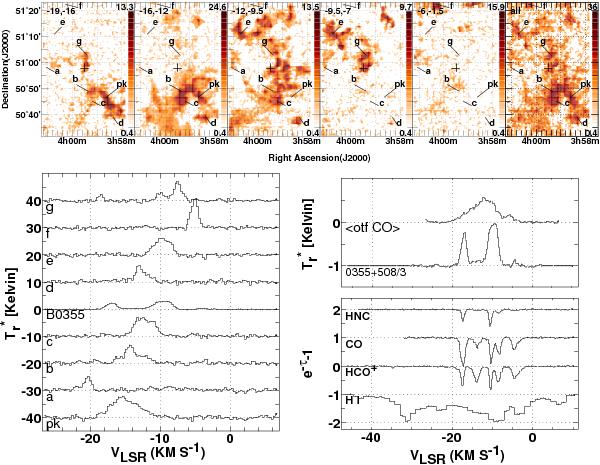
The sky field around the position of B0355+508. At top are maps of integrated CO intensity made over the velocity intervals indicated in each panel, corresponding to the five strong components of the HCO+ absorption profile seen at lower right. CO emission profiles at various locations indicated in the map panels are shown at lower left. CO emission profiles toward B0355+508 and averaged over the map area are shown above the absorption line profiles.
Current usage metrics show cumulative count of Article Views (full-text article views including HTML views, PDF and ePub downloads, according to the available data) and Abstracts Views on Vision4Press platform.
Data correspond to usage on the plateform after 2015. The current usage metrics is available 48-96 hours after online publication and is updated daily on week days.
Initial download of the metrics may take a while.