Fig. 10
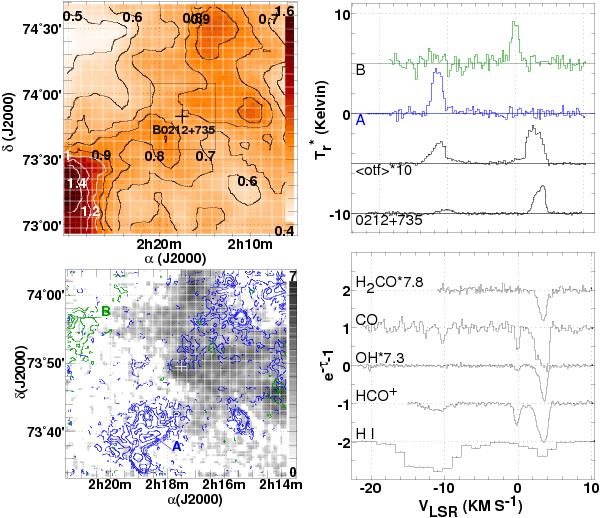
The sky field around the position of B0212+735, as in Fig. 2. Contours in the CO emission map at lower left are color coded in blue for emission at −15 ≤ v ≤ −9.5 km s-1 and in green for emission at −2 ≤ v ≤ 1 km s-1. The gray scale background represents the integrated emission of the strongest emission component seen toward the continuum source, at v = 1.5−5 km s-1. 12CO spectra at two locations labeled A and B are shown at upper right along with a strongly-scaled mean profile taken over the full map area.
Current usage metrics show cumulative count of Article Views (full-text article views including HTML views, PDF and ePub downloads, according to the available data) and Abstracts Views on Vision4Press platform.
Data correspond to usage on the plateform after 2015. The current usage metrics is available 48-96 hours after online publication and is updated daily on week days.
Initial download of the metrics may take a while.