Free Access
Fig. 5
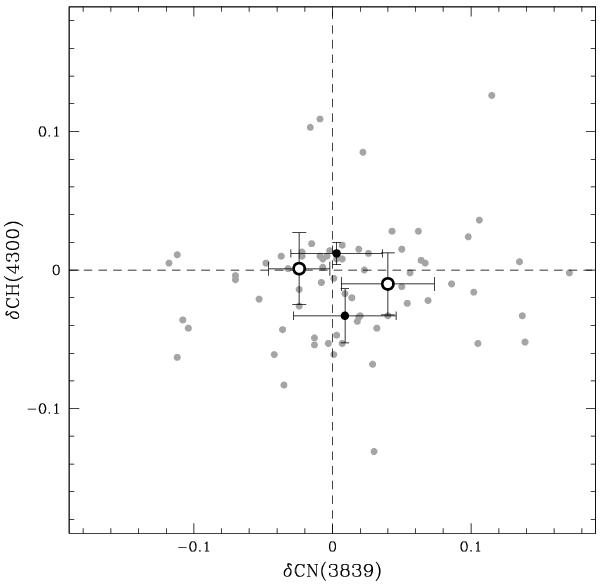
Plot for the distribution of CN and CH band strengths. Gray dots show measurements for stars. CH-weak and CH-strong stars are separated by the horizontal dashed line and their centroids with error bars (drawn at 1σ) are marked as black dots and large empty dots, respectively.
Current usage metrics show cumulative count of Article Views (full-text article views including HTML views, PDF and ePub downloads, according to the available data) and Abstracts Views on Vision4Press platform.
Data correspond to usage on the plateform after 2015. The current usage metrics is available 48-96 hours after online publication and is updated daily on week days.
Initial download of the metrics may take a while.