Free Access
Fig. 4
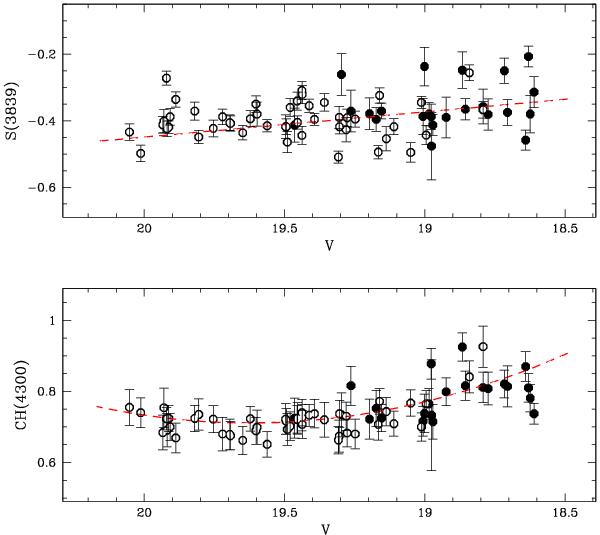
Measured S3839 and CH4300 indices for the program stars as a function of V. White dots are stars from Pancino et al. (2010), while black dots are from the IMACS sample. Dashed red lines in both panels are the median ridge lines used to eliminate temperature and gravity dependencies.
Current usage metrics show cumulative count of Article Views (full-text article views including HTML views, PDF and ePub downloads, according to the available data) and Abstracts Views on Vision4Press platform.
Data correspond to usage on the plateform after 2015. The current usage metrics is available 48-96 hours after online publication and is updated daily on week days.
Initial download of the metrics may take a while.