Fig. 3
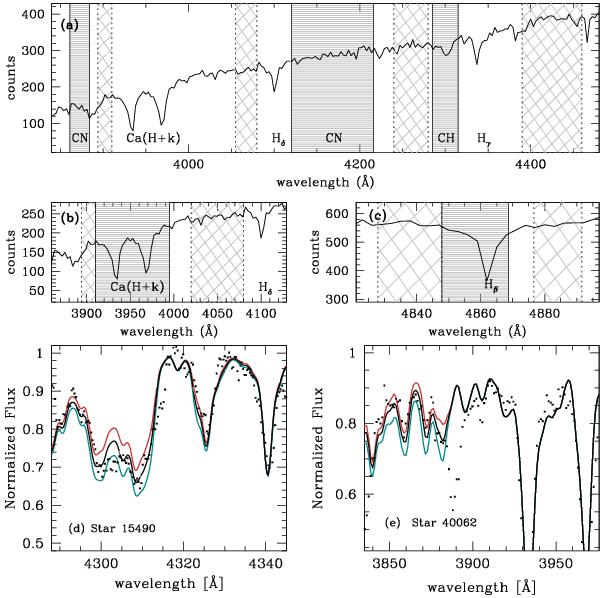
Panel a) example of the windows from which we measured the CN and CH indices (dark gray hatched regions) together with their respective continuum windows (light gray hatched regions). Panels b) and c) show the windows adopted for the H and K calcium index and the Hβ index. The non-normalized superimposed spectrum (star 41213, S/N ~ 35 in the S3839 region) was smoothed for clarity. Panel d) observed (small black dots) and synthetic (line) spectra around CH band for the star 15490. The black best fits, while the red and green lines are the syntheses computed with C abundance altered by ± 0.10 dex from the best value. Panel e) the same as in panel d) but for the CN feature for the star 40062. The synthetic spectra show the best fit (thick black line) and the syntheses computed with N abundance altered by ± 0.20 (thick red and green lines).
Current usage metrics show cumulative count of Article Views (full-text article views including HTML views, PDF and ePub downloads, according to the available data) and Abstracts Views on Vision4Press platform.
Data correspond to usage on the plateform after 2015. The current usage metrics is available 48-96 hours after online publication and is updated daily on week days.
Initial download of the metrics may take a while.