Fig. 12
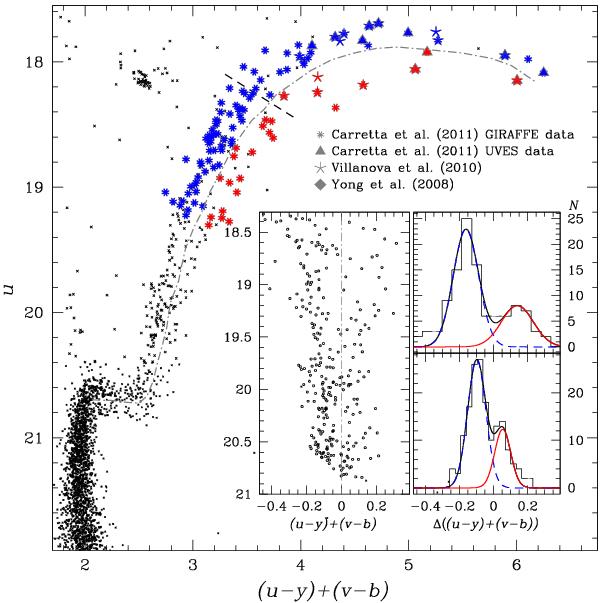
Main panel: reproduction of the CMD of Fig. 11. We used red color codes for red-RGB and faint-SGB stars, while blue-RGB and bright-SGB stars are represented in blue. Symbols refer to stars from spectroscopic studies as indicated in the figure. The rectified CMD and the histogram color distribution of RGB stars between the two dashed lines is shown in the inset (see text for details).
Current usage metrics show cumulative count of Article Views (full-text article views including HTML views, PDF and ePub downloads, according to the available data) and Abstracts Views on Vision4Press platform.
Data correspond to usage on the plateform after 2015. The current usage metrics is available 48-96 hours after online publication and is updated daily on week days.
Initial download of the metrics may take a while.