Free Access
Fig. 1
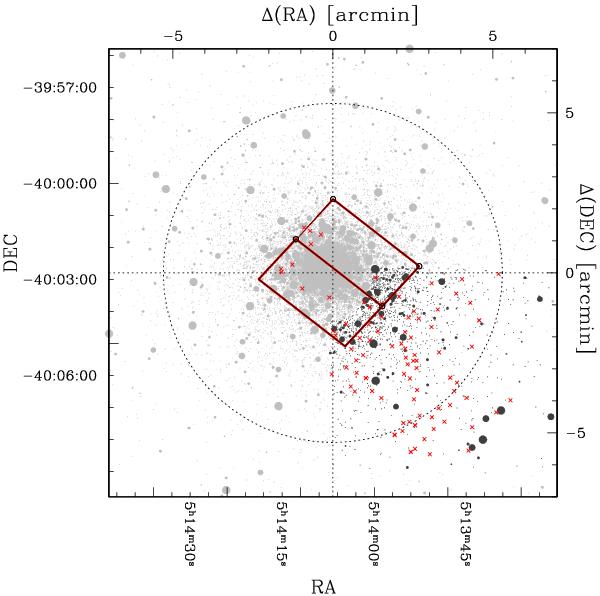
Area covered by the catalogs from which the spectroscopic selection was made: the FORS2 in the outer part (shown in black) and the ACS/HST field (continuous red line) in the inner region. The red crosses represent the IMACS+FORS2 sample. We also indicate the half tidal radius in this figure (dotted circle).
Current usage metrics show cumulative count of Article Views (full-text article views including HTML views, PDF and ePub downloads, according to the available data) and Abstracts Views on Vision4Press platform.
Data correspond to usage on the plateform after 2015. The current usage metrics is available 48-96 hours after online publication and is updated daily on week days.
Initial download of the metrics may take a while.