Fig. 7
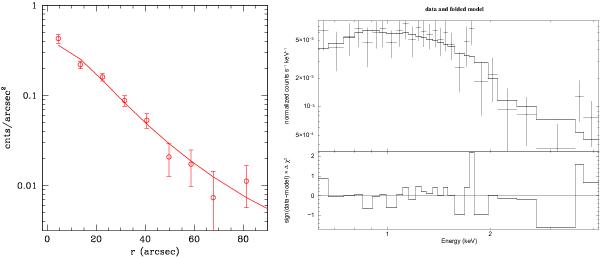
Left: net radial profile centered on the peak of the cluster emission (red open symbols). The solid line represents the best fit obtained with a β model with β ~ 0.7 and rc ~ 25.5′′. Right: spectral distribution of the cluster’s emission. The spectrum contains about 573.7 ± 38.6 net counts, binned to have at least 18 net counts in each spectral bin. Spectral model is APEC, the fit gives  for 26 d.o.f.
Current usage metrics show cumulative count of Article Views (full-text article views including HTML views, PDF and ePub downloads, according to the available data) and Abstracts Views on Vision4Press platform.
Data correspond to usage on the plateform after 2015. The current usage metrics is available 48-96 hours after online publication and is updated daily on week days.
Initial download of the metrics may take a while.