Free Access
Fig. 6
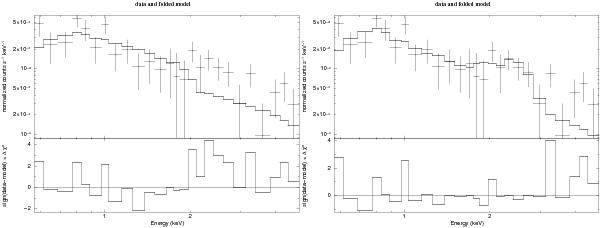
Spectral distribution for the emission compared to spectral models. The spectrum includes the contribution from H79a, H79b and H79d and excludes the other point sources. Spectral models used: left: APEC and Power Law. Right: APEC, Power Law and Gaussian at E ~ 2.4 keV.
This figure is made of several images, please see below:
Current usage metrics show cumulative count of Article Views (full-text article views including HTML views, PDF and ePub downloads, according to the available data) and Abstracts Views on Vision4Press platform.
Data correspond to usage on the plateform after 2015. The current usage metrics is available 48-96 hours after online publication and is updated daily on week days.
Initial download of the metrics may take a while.