Fig. 4
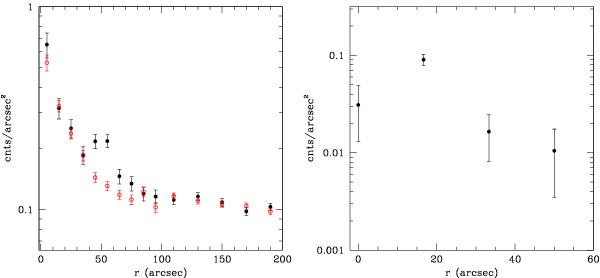
Left: radial profiles of the total emission centered on the peak of the cluster’s emission. The regions used for the profiles are shown in Fig. 3. Black/filled symbols refer to the SE quadrant (black solid line in Fig. 3), red/open symbols refer to the complementary 270 deg region (red dashed line in Fig. 3). Right: radial profile of HCG 79 centered at (RA = 15h59m11.9s, δ = + 20°45′31.0′′) the center of the optical halo (Da Rocha et al. 2005).
Current usage metrics show cumulative count of Article Views (full-text article views including HTML views, PDF and ePub downloads, according to the available data) and Abstracts Views on Vision4Press platform.
Data correspond to usage on the plateform after 2015. The current usage metrics is available 48-96 hours after online publication and is updated daily on week days.
Initial download of the metrics may take a while.