Fig. 3
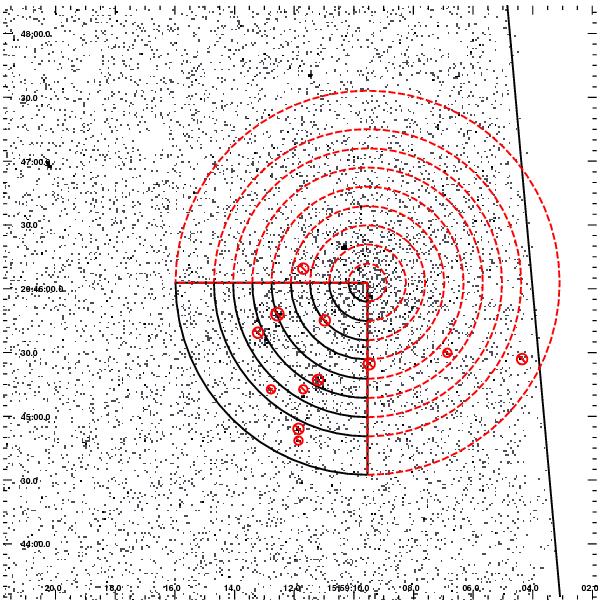
Chandra image in the (0.5–5) keV energy band. Regions used to derive the radial profile: solid/black for SE region (90 deg to 180 deg counter clockwise from N), dashed/red for the other three quadrants. Black slanted line traces the S3 chip border. Circles indicate detected point-like sources. The color version is available on line.
Current usage metrics show cumulative count of Article Views (full-text article views including HTML views, PDF and ePub downloads, according to the available data) and Abstracts Views on Vision4Press platform.
Data correspond to usage on the plateform after 2015. The current usage metrics is available 48-96 hours after online publication and is updated daily on week days.
Initial download of the metrics may take a while.