Free Access
Fig. 6
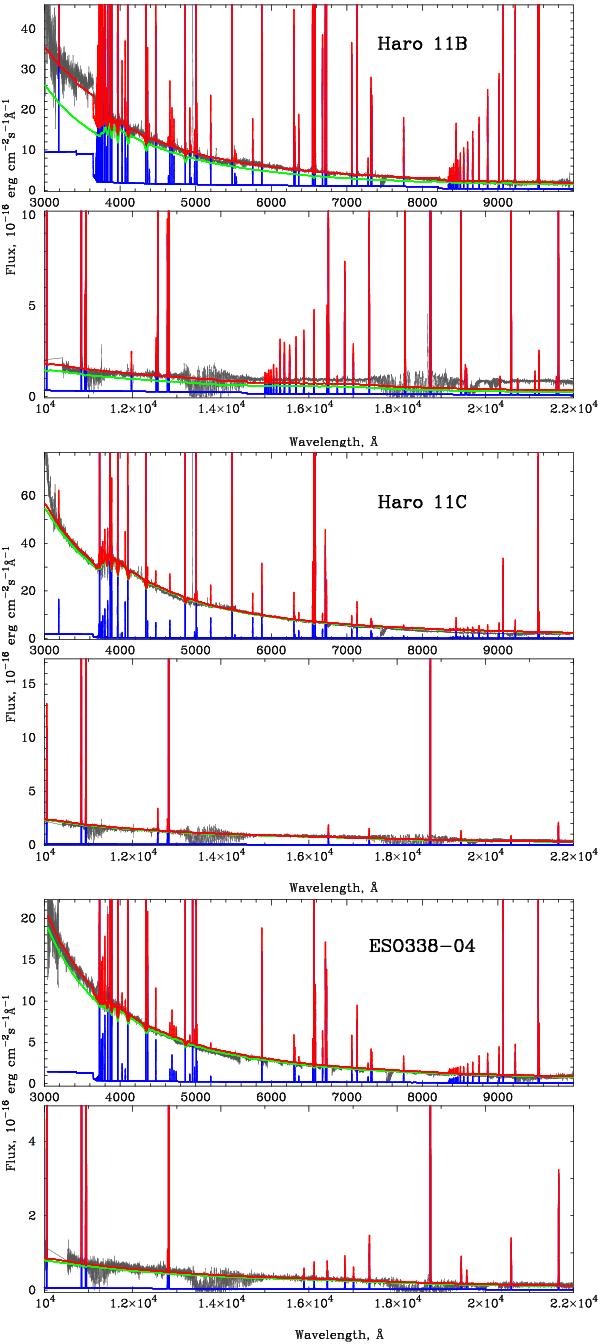
Best-fit model SED fits to the redshift- and extinction-corrected observed spectra of Haro 11B, Haro 11C, and ESO 338-IG 004. The contributions from the stellar and ionised gas components are shown by the green and blue lines, respectively. The sum of stellar and ionised gas emission is shown by the red line.
This figure is made of several images, please see below:
Current usage metrics show cumulative count of Article Views (full-text article views including HTML views, PDF and ePub downloads, according to the available data) and Abstracts Views on Vision4Press platform.
Data correspond to usage on the plateform after 2015. The current usage metrics is available 48-96 hours after online publication and is updated daily on week days.
Initial download of the metrics may take a while.