Fig. 5
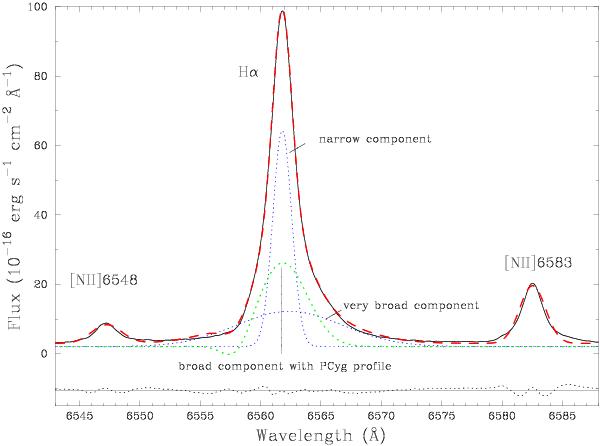
Decomposition of the Hα emission-line profile in the Haro 11C spectrum. Two Gaussian components (blue dotted lines) are likely related to nebular emission, a P Cyg profile (green dotted line) is a spectral feature of an LBV star. The residual is shown by the black dotted line. For a better view this is shifted below the zero value. Observational data are shown by the black solid line and the modelled profile, which includes all components, is displayed by the red dashed line.
Current usage metrics show cumulative count of Article Views (full-text article views including HTML views, PDF and ePub downloads, according to the available data) and Abstracts Views on Vision4Press platform.
Data correspond to usage on the plateform after 2015. The current usage metrics is available 48-96 hours after online publication and is updated daily on week days.
Initial download of the metrics may take a while.