Free Access
Fig. 4
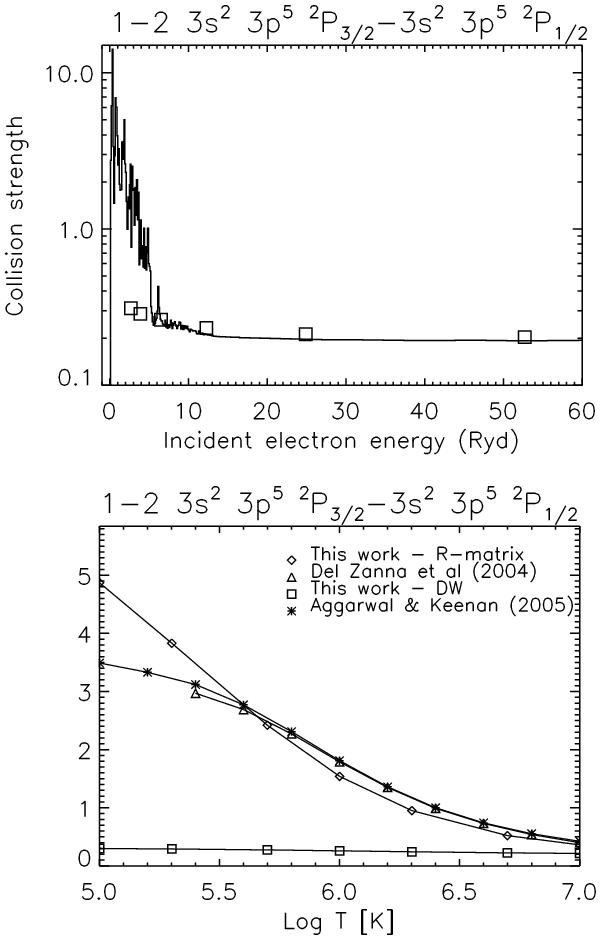
Above: collision strength for the forbidden red coronal line, averaged over 0.1 Ryd in the resonance region. The data points are displayed in histogram mode. Boxes indicate the DW values. Below: thermally-averaged collision strengths, with other calculations.
This figure is made of several images, please see below:
Current usage metrics show cumulative count of Article Views (full-text article views including HTML views, PDF and ePub downloads, according to the available data) and Abstracts Views on Vision4Press platform.
Data correspond to usage on the plateform after 2015. The current usage metrics is available 48-96 hours after online publication and is updated daily on week days.
Initial download of the metrics may take a while.