Fig. 5
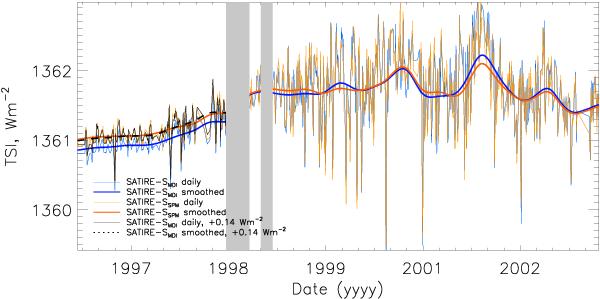
Reconstructions of KP/SPM (orange) and SoHO/MDI (blue) for the overlap period May 1996 to September 2003; KP/SPM is normalised to MDI after February 1999. Daily data are shown as thin lines, smoothed as thick, with the grey boxes covering periods when SoHO was out of contact. Prior to the loss of contact, MDI is also plotted shifted by a constant value (daily data, black thin solid line; smoothed, dashed thick line).
Current usage metrics show cumulative count of Article Views (full-text article views including HTML views, PDF and ePub downloads, according to the available data) and Abstracts Views on Vision4Press platform.
Data correspond to usage on the plateform after 2015. The current usage metrics is available 48-96 hours after online publication and is updated daily on week days.
Initial download of the metrics may take a while.