Fig. 3
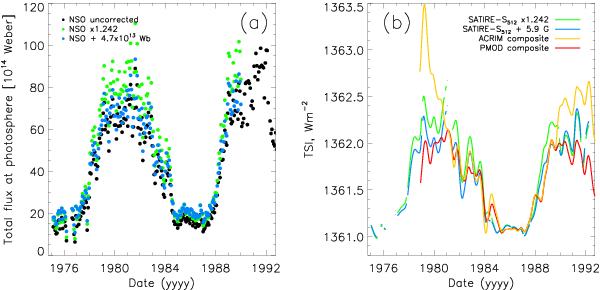
a) Total photospheric flux, obtained from KP/512 Carrington maps, before applying a correction (black dots), after either a scaling (green) or a shift is applied (blue). b) SATIRE-S reconstruction of TSI using KP/512 continuum intensity images and magnetograms only, with either a scaling or a shift compared to the ACRIM and PMOD composites. All datasets are smoothed and normalised to the minimum of 1986. Gaps in the curves are present when data gaps are larger than 27 days. See main text for scaling and shifts applied to KP/512 Carrington maps and magnetograms.
Current usage metrics show cumulative count of Article Views (full-text article views including HTML views, PDF and ePub downloads, according to the available data) and Abstracts Views on Vision4Press platform.
Data correspond to usage on the plateform after 2015. The current usage metrics is available 48-96 hours after online publication and is updated daily on week days.
Initial download of the metrics may take a while.