Free Access
Fig. 1
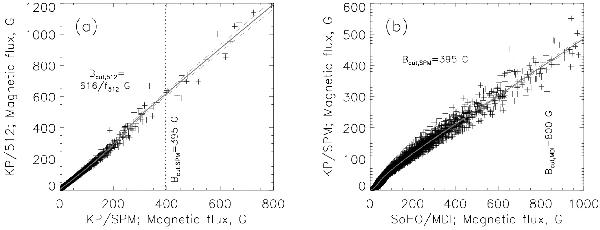
Histogram equating plots. a) 18 contemporaneous KP/SPM and KP/512 magnetograms and b) 84 contemporaneous SoHO/MDI and KP/SPM magnetograms. The grey line is the interpolated mean of the black crosses with the dashed grey lines the standard error. Dotted lines highlight the relationship of Bcut between the datasets.
Current usage metrics show cumulative count of Article Views (full-text article views including HTML views, PDF and ePub downloads, according to the available data) and Abstracts Views on Vision4Press platform.
Data correspond to usage on the plateform after 2015. The current usage metrics is available 48-96 hours after online publication and is updated daily on week days.
Initial download of the metrics may take a while.