Fig. 1
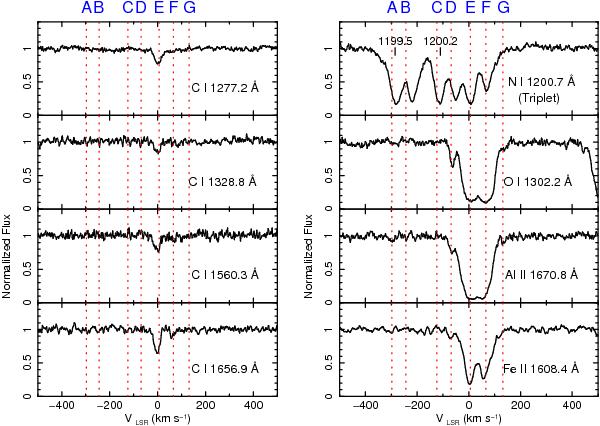
HST/COS absorption lines from the cold phase (ionization states I-II). The flux is normalized to the continuum emission and the lines are displayed in the Local Standard of Rest system. The rest frame wavelength of each resonance line is also given. The dotted lines represent the average velocities of the seven cloud systems (Kriss et al. 2011), which are also labeled as A to G.
Current usage metrics show cumulative count of Article Views (full-text article views including HTML views, PDF and ePub downloads, according to the available data) and Abstracts Views on Vision4Press platform.
Data correspond to usage on the plateform after 2015. The current usage metrics is available 48-96 hours after online publication and is updated daily on week days.
Initial download of the metrics may take a while.