Fig. 5
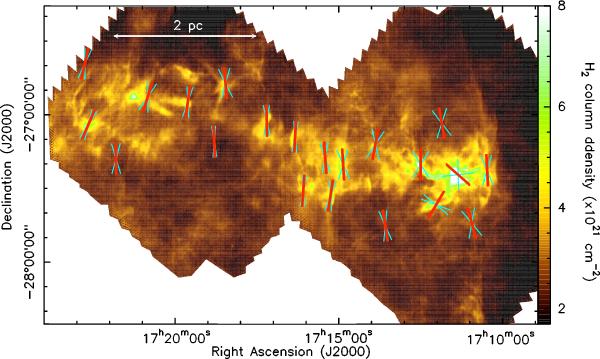
Herschel column density map of the B59 and Stem in the Pipe complex, as presented in Fig. 1. The red segments provide the direction of the local magnetic field as measured from near-infrared dust polarization data (Franco et al. 2010). The blue segments mark a ± 2σ deviation on either side of the nominal field direction. Note that gravitationally unstable regions, those lying above NH2 ≃ 7 × 1021 cm-2, correspond to the white areas.
Current usage metrics show cumulative count of Article Views (full-text article views including HTML views, PDF and ePub downloads, according to the available data) and Abstracts Views on Vision4Press platform.
Data correspond to usage on the plateform after 2015. The current usage metrics is available 48-96 hours after online publication and is updated daily on week days.
Initial download of the metrics may take a while.