Fig. 1
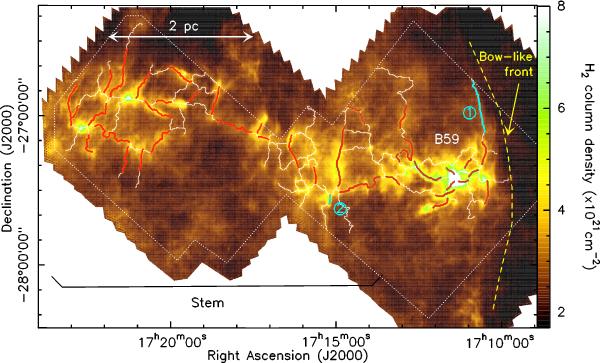
Herschel column density map of the Pipe Nebula on which is overlaid the filament network as traced with the DisPerSE algorithm (Sousbie 2011). The 43 filaments selected after eye inspection are displayed in red and cyan while the remaining filaments are displayed in white. Those presented in cyan and indicated with numbers are shown in more detail in Fig. 2. The white dotted polygon marks the area covered by both PACS and SPIRE imaging cameras. The yellow dashed line emphasizes the bow-like front of the B59 clump. The angular resolution of this image is 36′′ (HPBW). In this paper, we define the Stem the area of our Herschel map located above RA = 17h13m30s, while B59 corresponds to the region displayed in Fig. 6.
Current usage metrics show cumulative count of Article Views (full-text article views including HTML views, PDF and ePub downloads, according to the available data) and Abstracts Views on Vision4Press platform.
Data correspond to usage on the plateform after 2015. The current usage metrics is available 48-96 hours after online publication and is updated daily on week days.
Initial download of the metrics may take a while.