Fig. 5
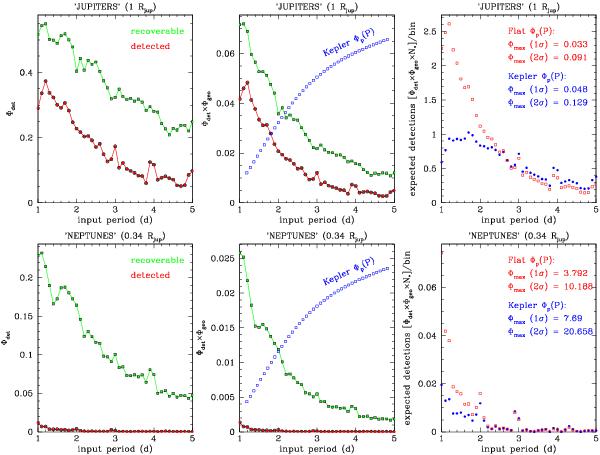
Completeness tests for cluster stars based on artificially injected transits, for 1 Rjup planets (upper row) and 0.336 Rjup planets (lower row). Left panels: detection efficiency Φdet as a function of the input period, for planets potentially recoverable (green symbols) and for those planets effectively detected by the criterion in Eq. (3) (red symbols). Middle panels: same as above, but Φdet is convolved with the geometrical probability Φgeo for a planet to transit. The Howard et al. (2011) Φp(P) period distribution function is plotted in blue symbols (arbitrary normalization). Right panels: number of expected transit detections per period bin, assuming one planet per star within 1 < P < 5 d. Φp(P) is assumed to be flat (red symbols) or as modeled by Howard et al. (2011) (blue symbols). 1- and 2-σ upper limits for the planet occurrence Φp,max are shown.
Current usage metrics show cumulative count of Article Views (full-text article views including HTML views, PDF and ePub downloads, according to the available data) and Abstracts Views on Vision4Press platform.
Data correspond to usage on the plateform after 2015. The current usage metrics is available 48-96 hours after online publication and is updated daily on week days.
Initial download of the metrics may take a while.