Fig. 3

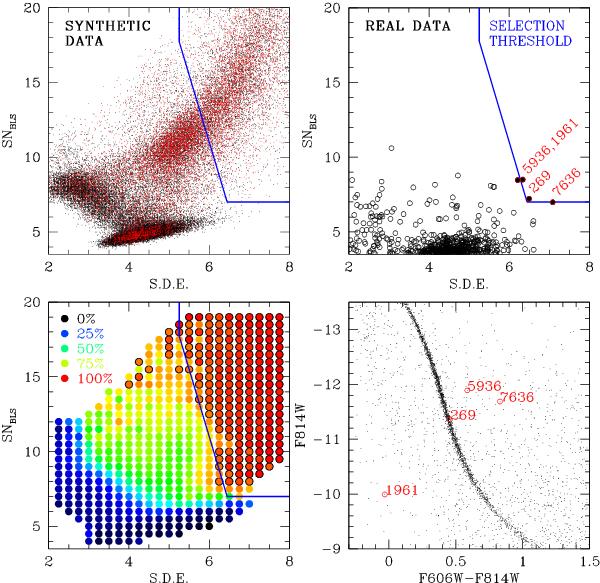
Upper left: distribution of SDE and SNBLS from the BLS analysis of 450 000 artificially injected transits in synthetic light curves. “Recovered” transits are plotted as red dots (see text). Lower left: same as above, where the parameter space has been divided into cells and color-coded as a function of the fraction f of transits successfully recovered. Cells with f > 90% (that is, with an incidence of false positives smaller than 10%) are highlighted with a black border. The blue line corresponds to the threshold defined in Eq. (3). Upper right: distribution of SDE and SNBLS from the BLS analysis of the full sample of 5078 real light curves. Four low-significance candidates are labeled. Lower right: location of the four low-significance candidates on the CMD.
Current usage metrics show cumulative count of Article Views (full-text article views including HTML views, PDF and ePub downloads, according to the available data) and Abstracts Views on Vision4Press platform.
Data correspond to usage on the plateform after 2015. The current usage metrics is available 48-96 hours after online publication and is updated daily on week days.
Initial download of the metrics may take a while.


