Fig. 2
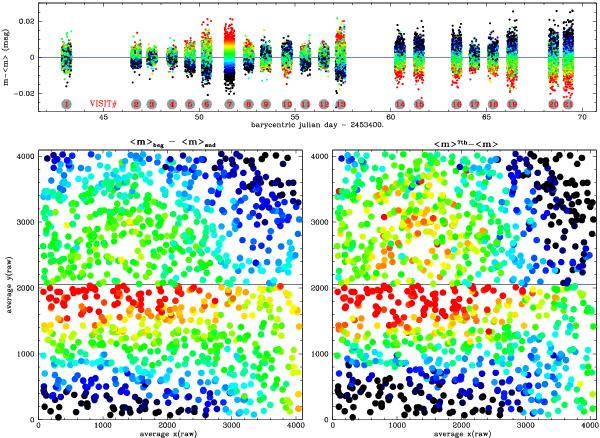
Mapping the PSF-ZP shift as a function of time and position on the ACS detector, with two different diagnostics (see text). The first (left panel) is the difference between the median magnitudes ⟨ m ⟩ beg and ⟨ m ⟩ end measured in frames taken respectively at the beginning and the end of the orbit, while the second (right panel) is the difference between the median magnitude of the star ⟨ m ⟩ 7th measured during the seventh “visit” of the program (2 453 451 < JD < 2 453 52), and the median magnitude ⟨ m ⟩ of its full light curve. Top panel: all the high-S/N light curves (σm < 0.02) have been registered to their average magnitude ⟨ m ⟩ . In all panels, the color scale spans the range −0.02−0.02 mag from black to red.
Current usage metrics show cumulative count of Article Views (full-text article views including HTML views, PDF and ePub downloads, according to the available data) and Abstracts Views on Vision4Press platform.
Data correspond to usage on the plateform after 2015. The current usage metrics is available 48-96 hours after online publication and is updated daily on week days.
Initial download of the metrics may take a while.