Fig. 1
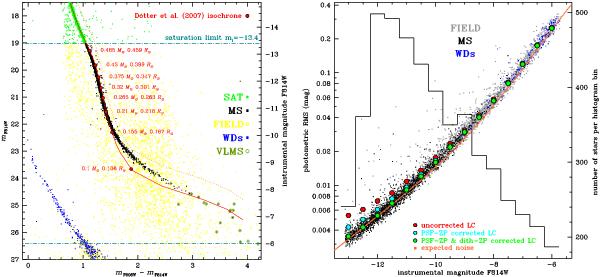
Left panel. Color–magnitude diagram (mF606W − mF814W,mF814W) for all the stars in the Anderson et al. (2008) master list; the 5078 sources selected in this work lie between the saturation limit at mF814W ≃ 19 and the faint limit mF814W ≃ 26.5 (dash-dot lines). The red line is the isochrone by Dotter et al. (2007) employed in Richer et al. (2008). The dotted line marks the loci occupied by equal-mass MS-MS binaries. Right panel. The rms for light curves in our sample as a function of the instrumental magnitude. Red circles: median rms averaged over 0.5 mag bins, without any correction. Cyan circles: the same, after PSF-ZP correction. Green circles: both PSF-ZP and dither-ZP corrections applied. Small points are the rms of the individual light curves after both corrections. The solid orange line is the expected theoretical noise level. The superimposed histogram represents the number of targets in each 0.5 mag bin (scale at the right).
Current usage metrics show cumulative count of Article Views (full-text article views including HTML views, PDF and ePub downloads, according to the available data) and Abstracts Views on Vision4Press platform.
Data correspond to usage on the plateform after 2015. The current usage metrics is available 48-96 hours after online publication and is updated daily on week days.
Initial download of the metrics may take a while.