Fig. 3
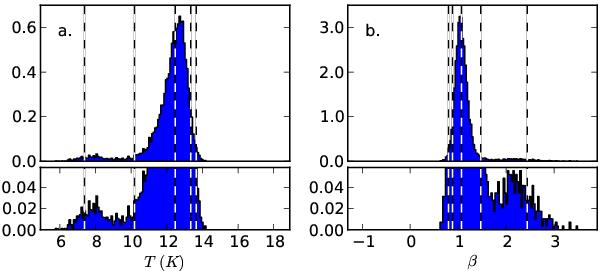
Marginal distributions (i.e. the probabilities integrated over the β and TC axes, respectively) of the points in Fig. 4. The upper frames show the probability density distributions of the TC and β parameters and the lower frames show a zoomed version of the upper frames. The histograms have been normalised to represent probability distributions (area normalised to one). The vertical dashed lines indicate the median of the distribution and the points where the tails of the distribution (one-sided) contain 5% or 1% of the data.
Current usage metrics show cumulative count of Article Views (full-text article views including HTML views, PDF and ePub downloads, according to the available data) and Abstracts Views on Vision4Press platform.
Data correspond to usage on the plateform after 2015. The current usage metrics is available 48-96 hours after online publication and is updated daily on week days.
Initial download of the metrics may take a while.