Fig. 10
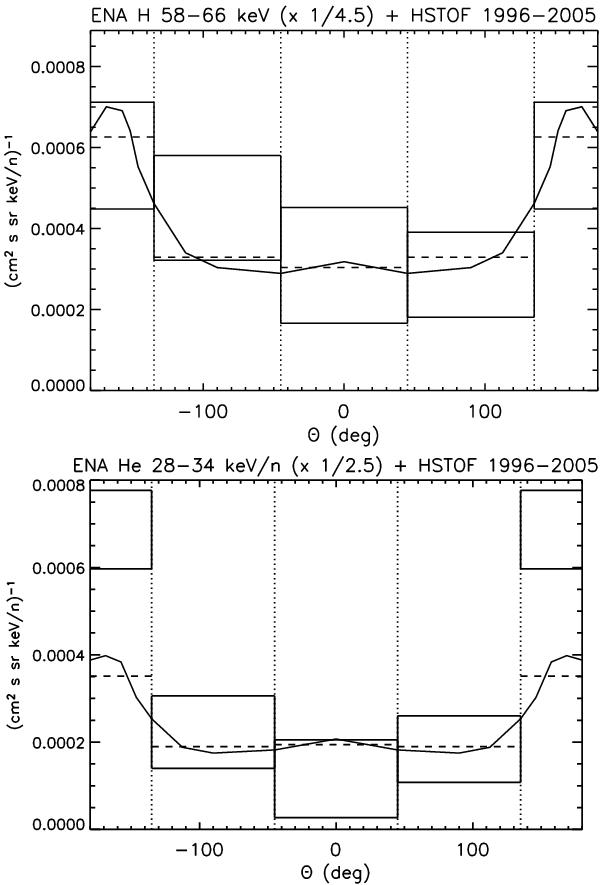
Directional dependence of the model hydrogen and helium ENA flux (solid line) compared with the HSTOF 1996−2005 data for four ecliptic longitude sectors (boxes). The HSTOF data correspond to the lowest energy bins (58−68 keV for hydrogen, 28−38 keV/n for helium). The height of the boxes is the same as the height of the error bars in Figs. 1, 2 (the lowest energy data points for 1996−2005). The model ENA flux is averaged over similar energy intervals (58−66 keV for H, 28−34 keV for He) and scaled down by the factors 1/4.5 (H) and 1/2.5 (He). The averages of the model flux over the ecliptic longitude sectors are shown by dashed lines.
Current usage metrics show cumulative count of Article Views (full-text article views including HTML views, PDF and ePub downloads, according to the available data) and Abstracts Views on Vision4Press platform.
Data correspond to usage on the plateform after 2015. The current usage metrics is available 48-96 hours after online publication and is updated daily on week days.
Initial download of the metrics may take a while.