Fig. 5
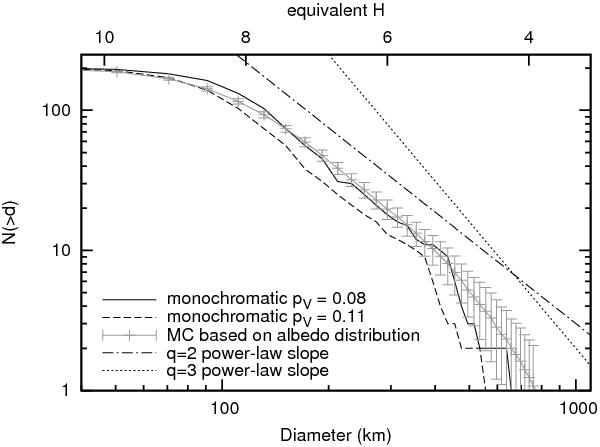
Cumulative Plutino size distributions N(≥ d) based on MPC H magnitudes and different assumptions: the solid and dashed line represent monochromatic albedo distributions using pV = 0.08 and pV = 0.11, respectively. The grey line shows the result of an averaged Monte Carlo simulations based on 100 runs and the measured albedo distribution with corresponding 1σ standard deviations. It is obvious that the monochromatic pV = 0.08 size distribution agrees better with the result of the Monte Carlo simulation. Furthermore, we show two cumulative power laws N(≥d) ~ d−q with q = 2 and q = 3 and arbitrary interceptions for comparison. A q = 2 cumulative power law better fits the measured size distribution in the size range 120–450 km, whereas the distribution of larger objects is better fit by a q = 3 cumulative power law. We can give an upper size limit for the kink at the small-sized end around 120 km. The upper abscissa gives the equivalent H magnitude based on a monochromatic albedo distribution of pV = 0.08.
Current usage metrics show cumulative count of Article Views (full-text article views including HTML views, PDF and ePub downloads, according to the available data) and Abstracts Views on Vision4Press platform.
Data correspond to usage on the plateform after 2015. The current usage metrics is available 48-96 hours after online publication and is updated daily on week days.
Initial download of the metrics may take a while.