Fig. 2
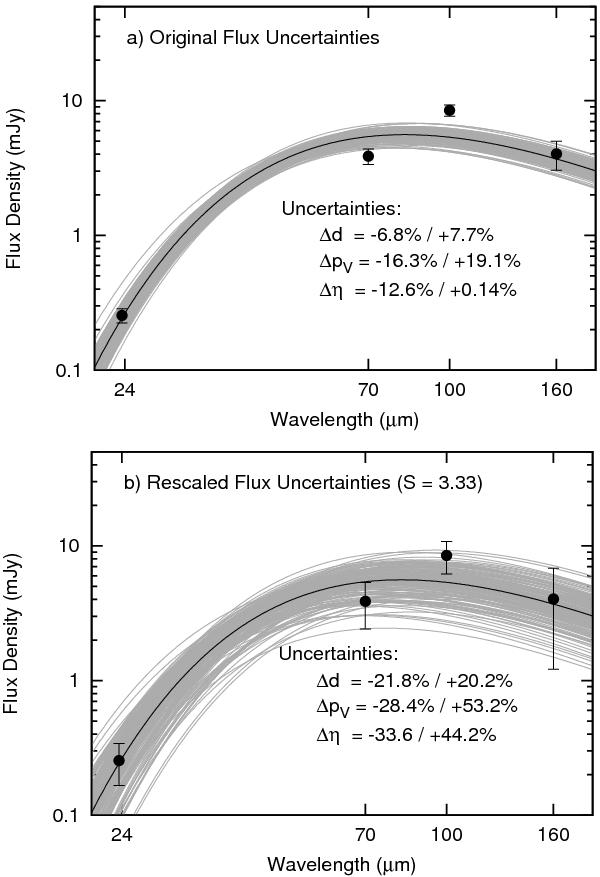
Illustration of the rescaled flux density uncertainties technique using synthetic
data. a) Filled circles represent the flux densities at the different
wavelengths with original flux density uncertainties. The dark line represents the
best fit line ( ); the grey lines are
fit lines of 100 out of 1000 synthetical bodies generated for the MC method. The bad
quality of the fit is obvious, since the 70 and 100 μm datapoints
are hardly fit by any of the single fit lines. Therefore, the reliability of the
uncertainties of the output parameters is questionable. b) By rescaling
the error bars by a factor of
); the grey lines are
fit lines of 100 out of 1000 synthetical bodies generated for the MC method. The bad
quality of the fit is obvious, since the 70 and 100 μm datapoints
are hardly fit by any of the single fit lines. Therefore, the reliability of the
uncertainties of the output parameters is questionable. b) By rescaling
the error bars by a factor of  ,
the broadness of the distribution of single fit lines is increased, which covers now
all datapoints. As a result, the output parameter fractional uncertainties are
increased and therefore more realistic.
,
the broadness of the distribution of single fit lines is increased, which covers now
all datapoints. As a result, the output parameter fractional uncertainties are
increased and therefore more realistic.
Current usage metrics show cumulative count of Article Views (full-text article views including HTML views, PDF and ePub downloads, according to the available data) and Abstracts Views on Vision4Press platform.
Data correspond to usage on the plateform after 2015. The current usage metrics is available 48-96 hours after online publication and is updated daily on week days.
Initial download of the metrics may take a while.