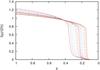
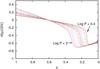
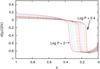
Fig. 1
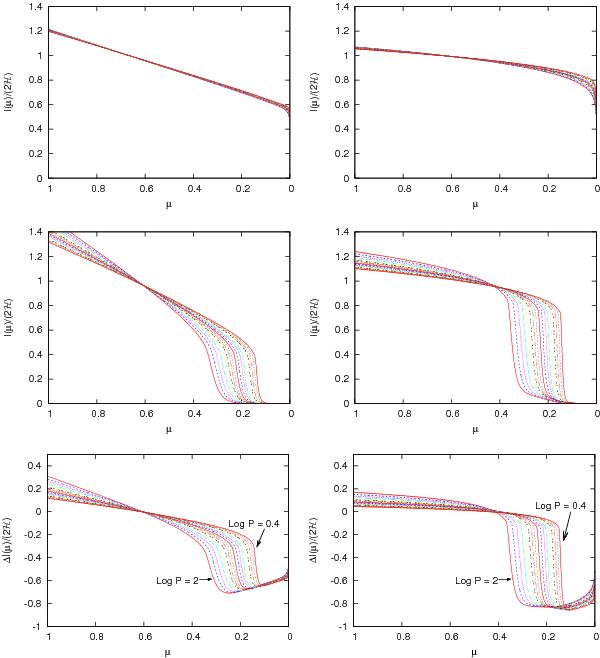
Predicted intensity profiles normalized with respect to the Eddington flux for plane-parallel model stellar atmosphere (top) and spherically-symmetric model atmospheres (middle) in V-band (left) and K-band (right) wavebands. The bottom panels show the difference between intensity profiles computed from spherically-symmetric and plane-parallel model atmospheres. Spherical models predict much smaller intensities near the stellar limb relative to the plane-parallel models. For spherical models, intensity profiles for short-period Cepheids have smaller central intensities and sharp declines at smallest value of μ. Each line represents a step of Δlog P = 0.1 from log P = 0.4–2.
Current usage metrics show cumulative count of Article Views (full-text article views including HTML views, PDF and ePub downloads, according to the available data) and Abstracts Views on Vision4Press platform.
Data correspond to usage on the plateform after 2015. The current usage metrics is available 48-96 hours after online publication and is updated daily on week days.
Initial download of the metrics may take a while.