Free Access
Fig. 2
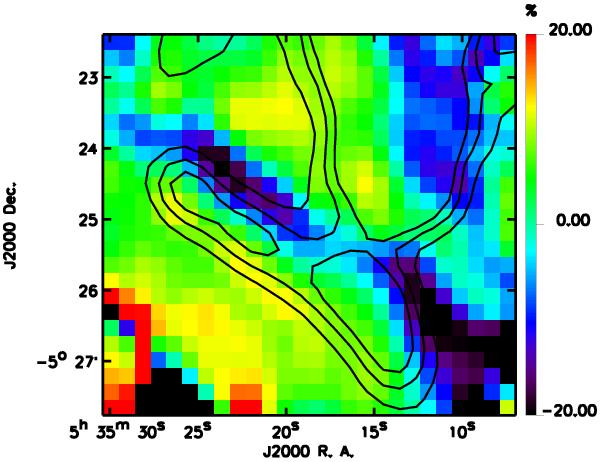
 : relative differences between the 250 μm observation brought to the 500 μm resolution using a 30.4″ FWHM Gaussian and the transition PSF obtained with our method; black contours show the 250 μm emission (levels: 10 500, 14 000, 17 500 MJy sr-1).
Current usage metrics show cumulative count of Article Views (full-text article views including HTML views, PDF and ePub downloads, according to the available data) and Abstracts Views on Vision4Press platform.
Data correspond to usage on the plateform after 2015. The current usage metrics is available 48-96 hours after online publication and is updated daily on week days.
Initial download of the metrics may take a while.