Free Access
Fig. 7
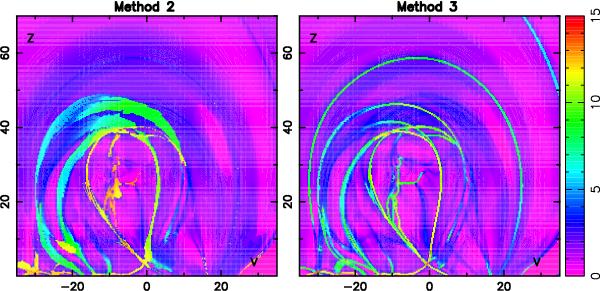
Distribution of Log10 Q in a vertical cut in the center of a NLFFF reconstruction of a sigmoid region observed on February 12th 2007 at 06:41 UT. Left: method 2 computed from the positive footpoints. Right: method 3 (proper method). A color version is available online.
This figure is made of several images, please see below:
Current usage metrics show cumulative count of Article Views (full-text article views including HTML views, PDF and ePub downloads, according to the available data) and Abstracts Views on Vision4Press platform.
Data correspond to usage on the plateform after 2015. The current usage metrics is available 48-96 hours after online publication and is updated daily on week days.
Initial download of the metrics may take a while.