Fig. 3
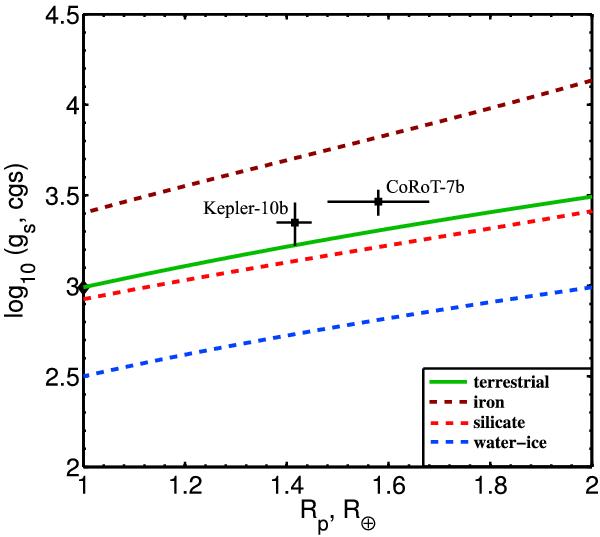
The logarithm of the surface acceleration as a function of planetary radius (log-g diagram) for Earth-like exoplanets (green curve) corresponding to planetary sizes of 1−2 R⊕. To define boundaries and illustrate the calculated trends, the expected log-g for homogeneous, self-compressible spheres of iron, silicate, and high-pressure water ice have been added as dashed lines. The black diamond represents the position of the Earth. The crosses denote the relative position of CoRoT-7b (C3) and Kepler-10b (K1), respectively, and indicate their observational uncertainties.
Current usage metrics show cumulative count of Article Views (full-text article views including HTML views, PDF and ePub downloads, according to the available data) and Abstracts Views on Vision4Press platform.
Data correspond to usage on the plateform after 2015. The current usage metrics is available 48-96 hours after online publication and is updated daily on week days.
Initial download of the metrics may take a while.