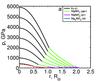
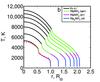
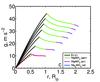
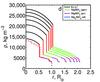
Fig. 1

Radial profiles of a) pressure, b) temperature, c) gravity, and d) density for generic Earth-like exoplanets ranging from 1 (lowermost curve) to 15 M⊕ (uppermost curve): the four compositional layers are represented by different colors, while the solid red lines in panel d) indicate discontinuities caused by pressure-induced phase transitions or step-wise compositional changes. The dashed red lines denote a reference Earth model.
Current usage metrics show cumulative count of Article Views (full-text article views including HTML views, PDF and ePub downloads, according to the available data) and Abstracts Views on Vision4Press platform.
Data correspond to usage on the plateform after 2015. The current usage metrics is available 48-96 hours after online publication and is updated daily on week days.
Initial download of the metrics may take a while.