Fig. 9
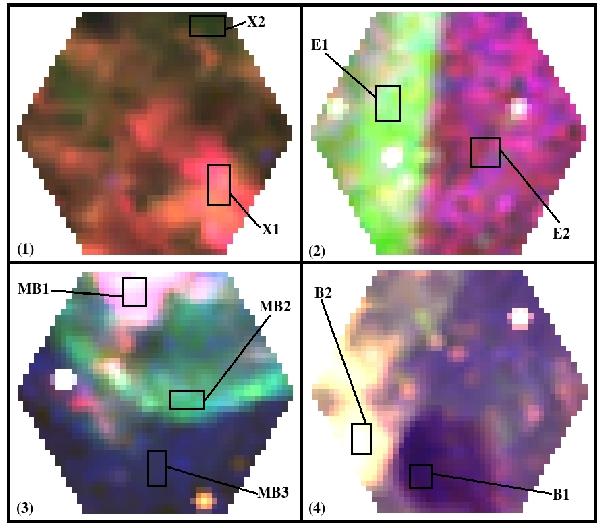
Displays using E3D of the four areas observed with PPAK. Boxes show regions where the integrated spectra were created: (1) X-ray zone, (2) edge, (3) mini-bubble, and (4) bullet. All the images are RGB-combinations of three wavelengths: red corresponds to the Hα+[NII], green to [OIII], and blue to [OII]. Arbitrary scales. Orientation as in Fig. 2.
Current usage metrics show cumulative count of Article Views (full-text article views including HTML views, PDF and ePub downloads, according to the available data) and Abstracts Views on Vision4Press platform.
Data correspond to usage on the plateform after 2015. The current usage metrics is available 48-96 hours after online publication and is updated daily on week days.
Initial download of the metrics may take a while.