Free Access
Fig. 8
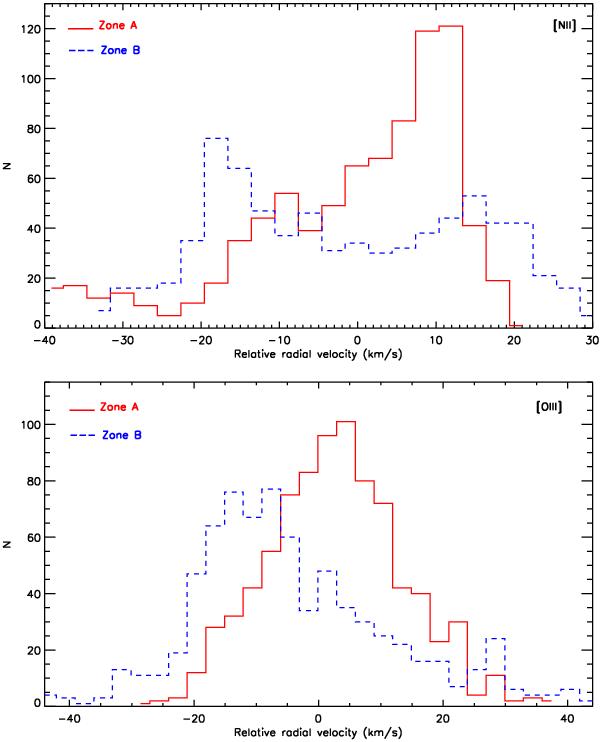
Statistical frequency distributions of the radial velocity of [NII]λ6584 Å and [OIII]λ5007 Å. Solid red lines indicate pixels from Zone A and dashed blue lines from Zone B. Velocities are given in units of km s-1 taking as zero the mean velocity measured for the emission line.
Current usage metrics show cumulative count of Article Views (full-text article views including HTML views, PDF and ePub downloads, according to the available data) and Abstracts Views on Vision4Press platform.
Data correspond to usage on the plateform after 2015. The current usage metrics is available 48-96 hours after online publication and is updated daily on week days.
Initial download of the metrics may take a while.