Fig. 5
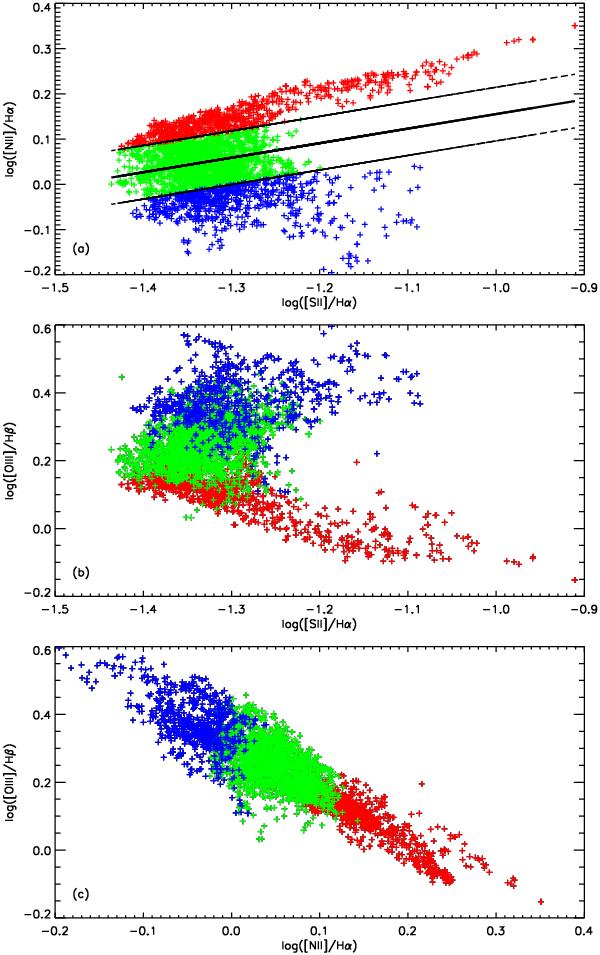
Diagnostic diagrams with data from the 2D study of the X-ray pointing. From the top to the bottom: a) [NII]λλ6584/Hα vs. [SII]λλ6731/Hα, b) [OIII]λλ5007/Hβ vs. [SII]λλ6731/Hα, and c) [OIII]λλ5007/Hβ vs. [NII]λλ6584/Hα. All the spaxels of the intensity maps are represented with crosses. Black lines in the first diagram are the fit performed and the ± 3σ limits. Colours help us to locate points spatially in Fig. 6: red corresponds to Zone A, blue is Zone B, and green represents Zone C (see text for details).
Current usage metrics show cumulative count of Article Views (full-text article views including HTML views, PDF and ePub downloads, according to the available data) and Abstracts Views on Vision4Press platform.
Data correspond to usage on the plateform after 2015. The current usage metrics is available 48-96 hours after online publication and is updated daily on week days.
Initial download of the metrics may take a while.