Free Access
Fig. 4
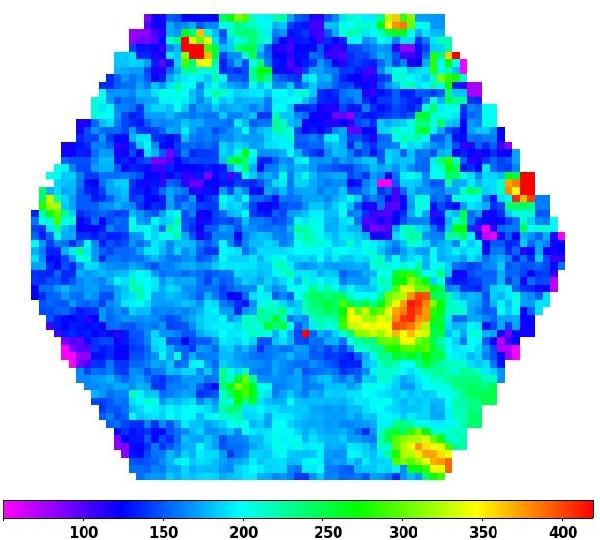
Electron density ne map derived from the [SII]λλ6717/6731 line ratio. The ne distribution ranges from ~50 cm-3 to a maximum peak of 410 cm-3, with a mean of 178 cm-3. Orientation as in Fig. 2.
Current usage metrics show cumulative count of Article Views (full-text article views including HTML views, PDF and ePub downloads, according to the available data) and Abstracts Views on Vision4Press platform.
Data correspond to usage on the plateform after 2015. The current usage metrics is available 48-96 hours after online publication and is updated daily on week days.
Initial download of the metrics may take a while.