Fig. 2
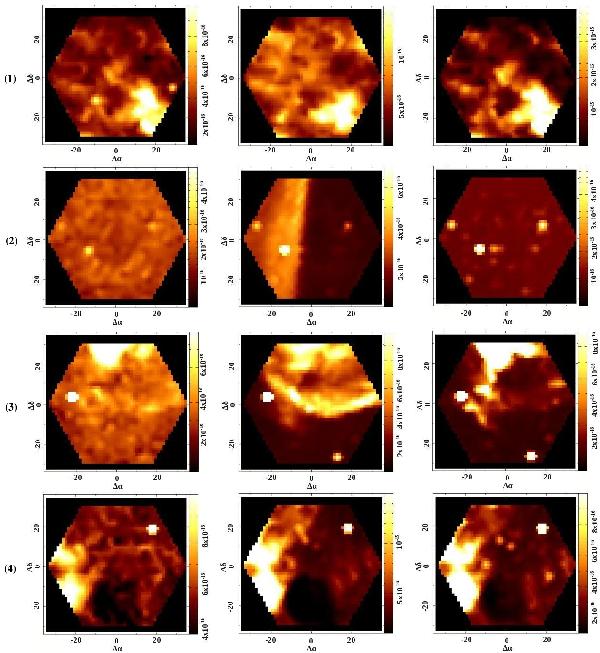
Images of the four pointings of NGC 6888. Columns are emission lines: from left to right [OII]λλ3726, 3728 Å, [OIII]λ5007 Å, and [NII]λλ6548, 6584 Å+Hα. The four different rows show the four regions observed; from top to bottom: (1) X-ray zone, (2) edge, (3) mini-bubble, and (4) bullet. In all the maps, north is down and east to the left.
Current usage metrics show cumulative count of Article Views (full-text article views including HTML views, PDF and ePub downloads, according to the available data) and Abstracts Views on Vision4Press platform.
Data correspond to usage on the plateform after 2015. The current usage metrics is available 48-96 hours after online publication and is updated daily on week days.
Initial download of the metrics may take a while.