Fig. 14
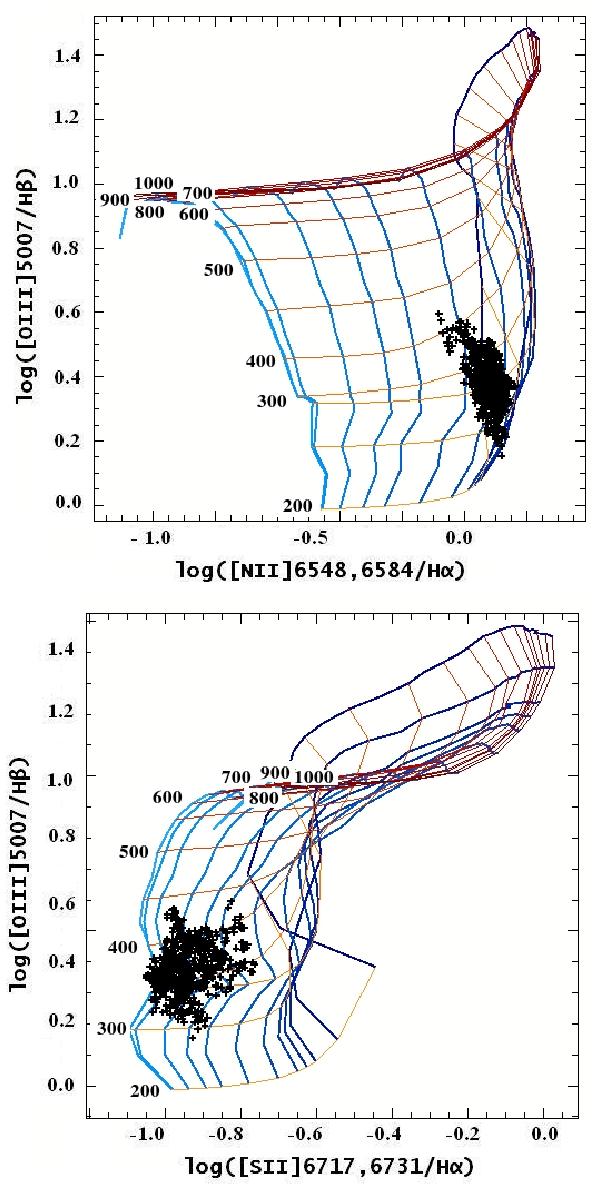
Diagnostic diagrams: [OIII]λλ5007/Hβ vs. [NII]λλ6548, 6584/Hα top, and [OIII]λλ5007/Hβ vs. [SII]λλ6717, 6731/Hα bottom. Grids represent the prediction from the shock models using libraries from Allen et al. (2008). Numbers over the lines indicate the value of the shock velocity represented by red lines, while the blue lines are models with equal magnetic field. Crosses are the pixels from NGC 6888 maps belonging to the Zone B. Only data from Zone B are represented well in both diagrams by a model with shock and precursor, velocities from 250 to 400 km s-1, n = 1000 cm-3, and twice solar abundance.
Current usage metrics show cumulative count of Article Views (full-text article views including HTML views, PDF and ePub downloads, according to the available data) and Abstracts Views on Vision4Press platform.
Data correspond to usage on the plateform after 2015. The current usage metrics is available 48-96 hours after online publication and is updated daily on week days.
Initial download of the metrics may take a while.